
The Search Dilemma - Part 2
One of the most interesting things I’ve come across during my masters years is how applications behave. Obviously, some applications are more prone to code optimization than others, and those applications will most likely be composed of some cpu-intensive functions that may eventually turn into bottlenecks if put in a heavy-load production environment. One of my hypothesis to maintain quality of service and reduce energy consumption consisted in analyzing that specific hot function and monitoring threads - a thread in a core would eventually have its operating frequency upgraded while executing that function and, after it exits the hot function, the operating frequency would be degraded. The assumption is that some functions does not need to execute as faster as the hot function, and hence is consuming more energy.
Let’s go work again with Elasticsearch and start measuring energy consumption. Since the system we’re using is ARM’s Juno board, we can analogue the “upgrading operation frequency” as “moving to big cores[N1]” and “downgrading operating frequency” being the same as “moving (back) to little cores[N1]”. We already know, from Part 1, that some queries takes longer to process than others and that it’s really influentiated by its keylength size. Let’s check the consumpting by running buckets of keywords with 1 to 4 keylength size and 10 to 14 in both types of processors. The energy measuring is done through ARM’s readenergy.c code and we essentially measure energy when we start all requests and when we end - a subtraction will give us what we desire. The results are below.
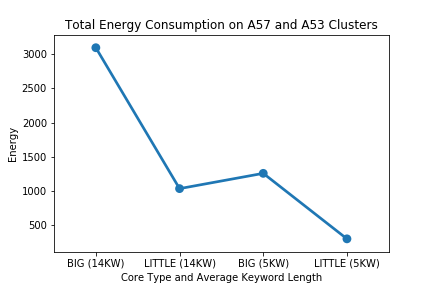
This graph is not really the best I could do, but it shows that our energy consumption is way lower on little cores, so using it most of the time will grant us an energy efficiency; plus, the 95-percentile onwards of queries will miss the imposed deadline if we keep them in those, hence it’s in our interest to differentiate between ‘light’ and ‘heavy’ queries, and move the ‘heavy’ ones to the big cores. The hypothesis seen in the introduction of this text is based on the fact that there’s something of difference between those two types of queries - probably due to the functions.
In order to check this, let’s do some profiling it using Linux’s perf. Brendan Gregg’s blog has a full writeup of how to use perf to translate JVM symbols into something readable and also how to generate flame graphs[N2] - and that’s what we did. The figure below shows what we obtained.
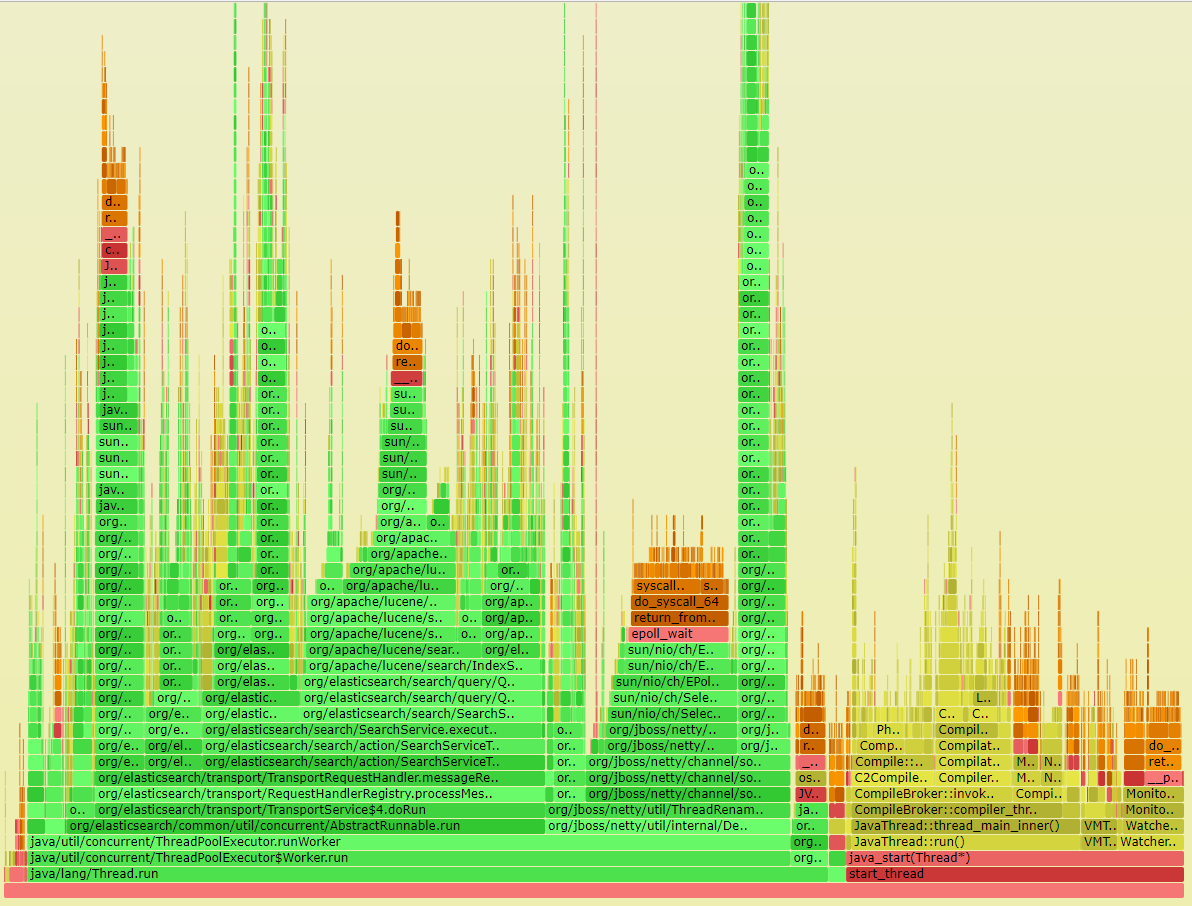
Although the original uses the .svg format, it’s pretty messy to work with, but we know that there are some cpu-intensive functions within Elasticsearch. I decided to use another script to re-draw the results, and it’s prettier.
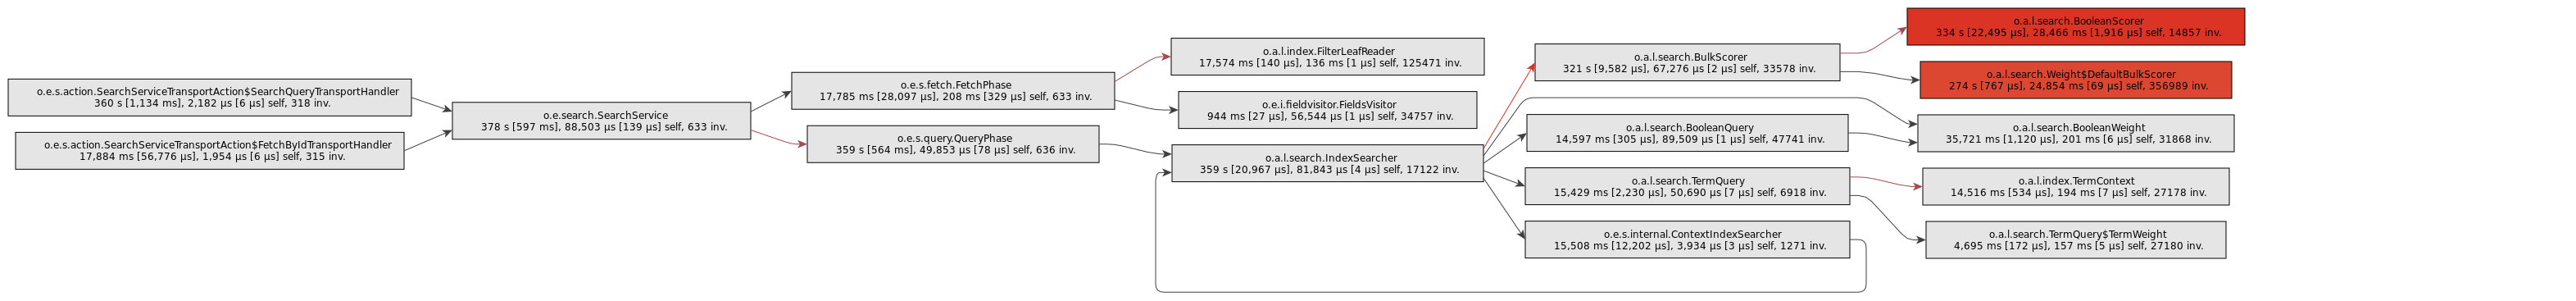
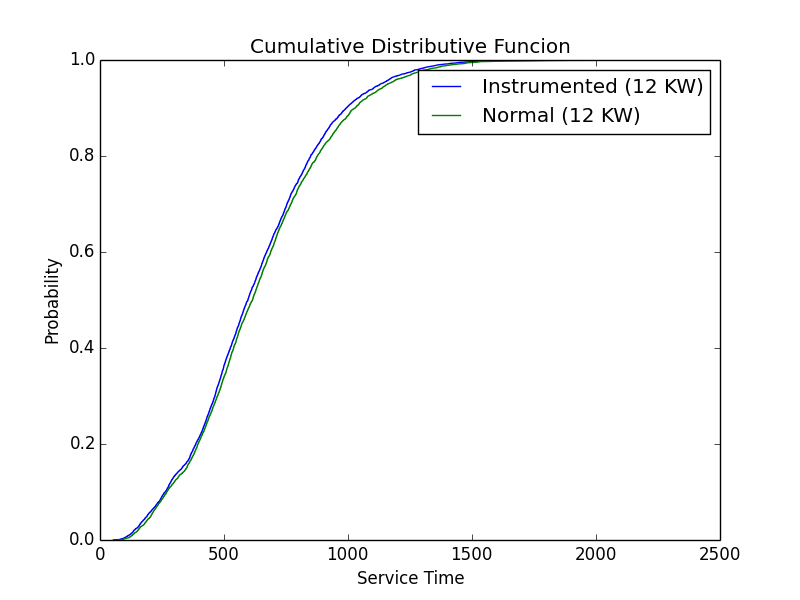
Now I know that the Search function in Elasticsearch takes the bulk of processing - well, that was expected. Even more, the intensive function is likely related to the scoring of the documents during the search (so you get relevant results first). Since it’s called too much, we can go back a few times in the flowchart and use another one - I decided to use the QueryPhase function. The first test was simple: let’s recompile elasticsearch and simply move threads whenever they enter and exit that specific function[N3]. The initial results? Surprisingly, not much of a difference.
I’ll discuss more ideas in next post.
Notes:
[N1] I’ll use the notation ‘big’ and ‘little’ to refer to the processors that are designed into the big.LITTLE architecture. It’s way easier to write and discuss.
[N2] Some times, perf won’t work well with JVM for a lot of reasons. A workaround for this is using the XX:+PreserveFramePointer flag, which introduces some mild degree of overhead. For more real-time profiling, with tools like BCC (a collection of tracers based in Linux’s BPF), there’s the +ExtendedDTraceProbe flag which introduces severe overhead - more than enough to not allow it in a production environment. Additionally, some visual profilers can also be found and do a proper job, although most are paid (e.g.: YourKit).
[N3] Due to its sandboxed model, the Java Virtual Machine has a lot of code that does not let workers/threads to access admin-space of the operating system. In order to allow our java threads change cores (or even write to the memory), we had to run the application with the -Dsecurity.manager.enabled=false flag.